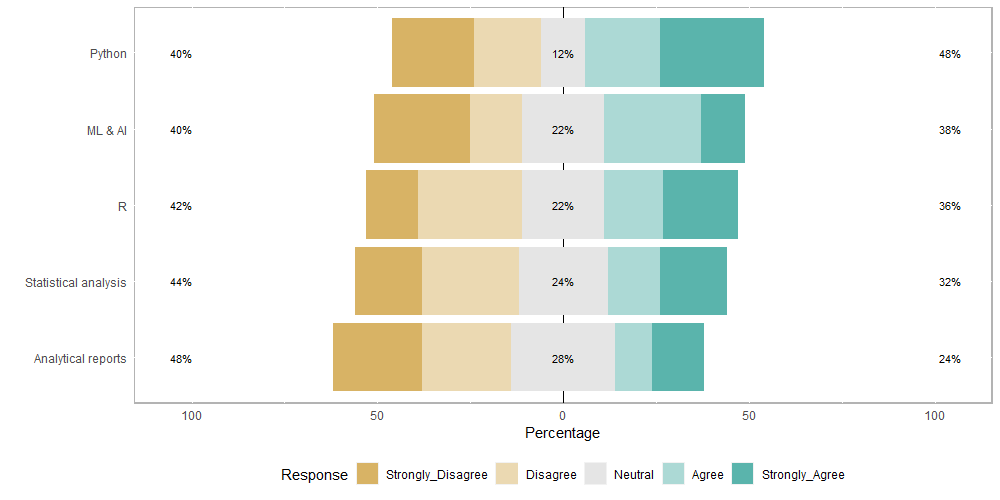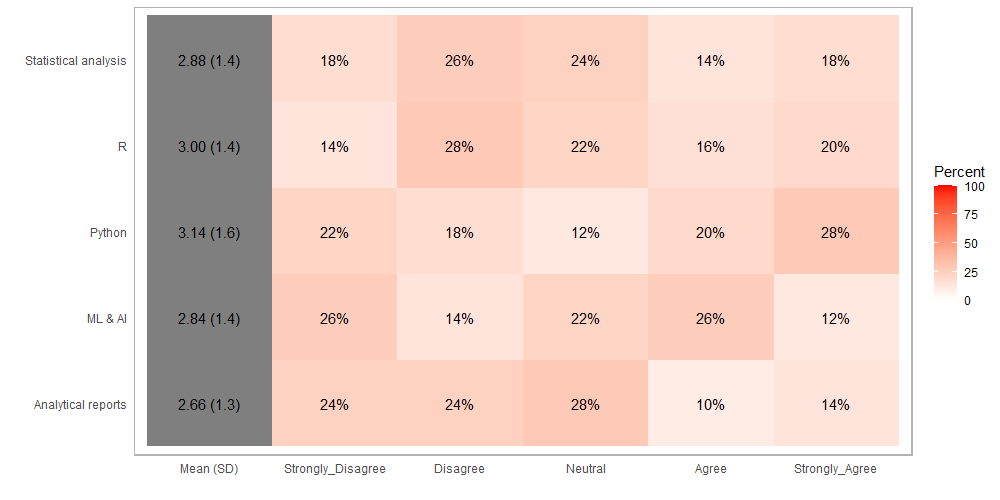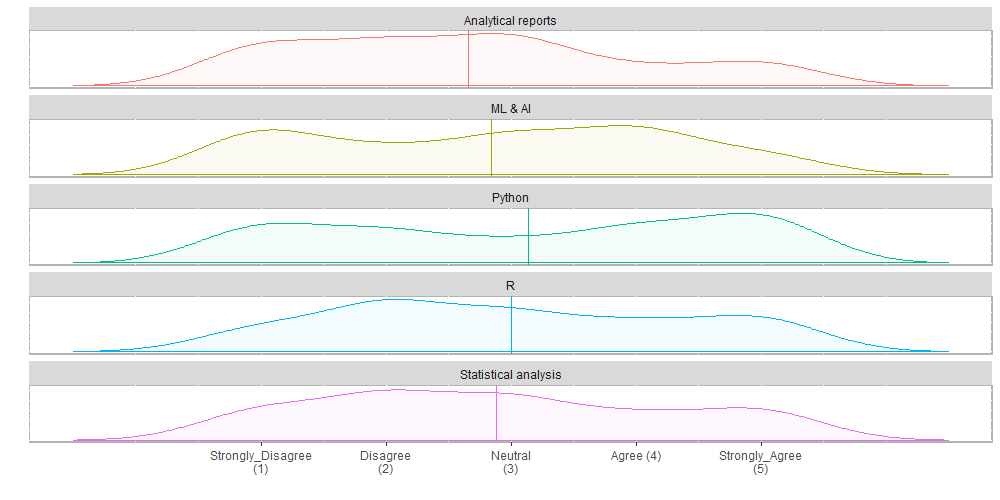
لتصوير بيانات الاجابات على مقياس ليكرت في الدراسات الإحصائية يمكن استخدام مكتبة (likert) وهي حزمة في لغة البرمجة آر R تعرض نتائج ليكرت جنبًا إلى جنب مع مخططات الكثافة لمساعدة الباحثين في تحديد ما إذا كان يمكن استخدام الاجابات على مقياس ليكرت من الناحية الكمية بدلاً من النوعية. لتوضيح القيام بذلك سوف نستخدم البيانات (Likert_data) ثم نتبع الخطوات التالية:
1. تحميل المكتبة (likert):
In:
library("likert")
2. استيراد البيانات:
In:
df = read.csv("Likert_data.csv",check.names=FALSE)
head(df)
Out:
  ID                 R            Python Statistical analysis Analytical reports           ML & AI
1  1             Agree          Disagree    Strongly_Disagree  Strongly_Disagree             Agree
2  2 Strongly_Disagree    Strongly_Agree             Disagree     Strongly_Agree             Agree
3  3             Agree Strongly_Disagree              Neutral  Strongly_Disagree Strongly_Disagree
4  4           Neutral           Neutral    Strongly_Disagree            Neutral Strongly_Disagree
5  5    Strongly_Agree          Disagree             Disagree  Strongly_Disagree    Strongly_Agree
6  6    Strongly_Agree             Agree              Neutral            Neutral Strongly_Disagree
3. تهيئة البيانات:
In:
df=df[,2:6]
levels = c("Strongly_Disagree", "Disagree", "Neutral", "Agree", "Strongly_Agree")
index = 1:ncol(df)
df[ ,index] = lapply(df[ , index], function(x) factor(x, levels = levels))
4. استخدام مكتبة (likert):
In:
out = likert(df)
5. تصوير البيانات:
5.1 باستخدام (rstacked ba):
In:
plot(out)
Out:
5.2 باستخدام (heat map):
In:
plot(out, type="heat", low.color = "white", high.color = "red")
Out:
5.3 باستخدام دالة الكثافة (density function)
In:
plot(out, type="density")
Out:

